What will you choose? ACL/Galvanize, Arbutus, Tableau, PowerBI, Python, R, Excel, Something Else?

A long time ago, we had data analytics software and big ideas, but occasionally our ideas were bigger than the built-in functionality provided in the software. Data is data though and with access to basic tools to manipulate it, we could take the next step and made those tools do things beyond the out-of-the-box software capabilities.
To get today’s challenge out there at the top of this article, I’m putting it here. Then I’ll share some examples from the past about what we did “back in the day” to make the data dance the way we wanted.
The Challenge – Data File
The data I am working with is contract awards data. Here is a simple table layout to represent what I am working with:
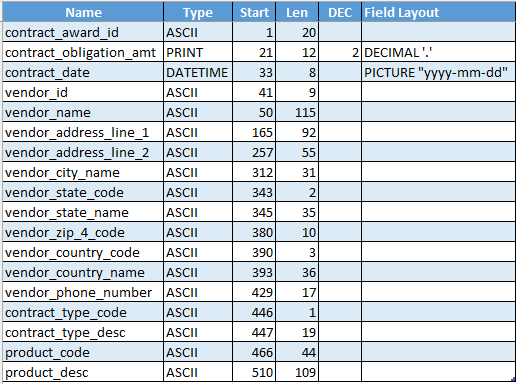
Some additional information about the data fields:
- contract_award_id is unique in the table
- contract_obligation_amt is the dollar value that I wish to total
- vendor_id uniquely identifies a vendor, they may recur in the file and have multiple contract_award_ids
- contract_type_code and product_code are the two fields relevant to this challenge, but if you solve for one, the other follows the same solution
If you want a sample data file, grab this one https://hidrive.ionos.com/share/a0rj4f4aug
The Challenge – Defined
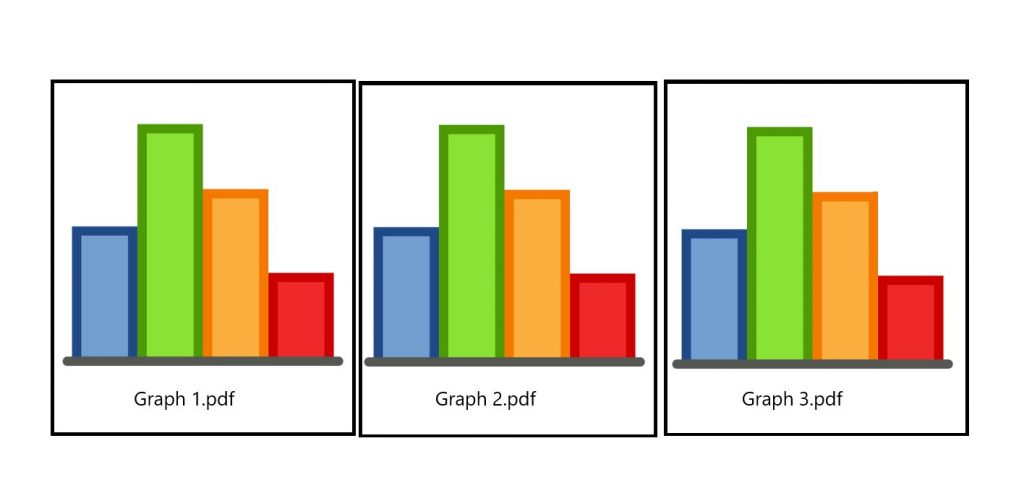
For each product_code, produce a 1 page *.pdf file containing a bar graph of the top 10 vendor_ids for that product_code. “Top 10” vendor_ids are defined by the highest total of all of their contract_obligation_amt for that product_code.
Then apply the same solution for contract_type_code. In the sample file, you will find there are far fewer of these codes. For each contract_type_code, produce a 1 page *.pdf file containing a bar graph of the top 10 vendor_ids for that contract_type_code. “Top 10” vendor_ids are defined by the highest total of all of their contract_obligation_amt for that contract_type_code.
Sound easy? That’s what I thought as well. I started out by using Arbutus Analyzer but was unable to write a procedure to create a graph output to a file. I’m thinking of focusing on writing an Excel macro next. Then I’ll move on to Python. I might even try out using Tableau or PowerBI but haven’t tried automating this kind of output from either of those visualization tools yet. I’ll likely circle back to ACL/Galvanize/Diligent Desktop to see if I can get a graph output with a script. I feel like there is a solution with Highbond HCL as well. Who knows, maybe I’ll try it in Alteryx!
The Challenge – Submit Your Success!
Yes, it will take me a while to try out all of the options listed above. And it is likely that I have missed an obvious tool or data programming approach. Take a stab at it and flex on me. I want to see some solutions that work. Email challenge@krobothconsulting.com or post in the comments below your:
- Description of Approach
- Tools Used
- Example Output
- Code Used (optional)
Historic Backstory
Alright, now that the challenge presentation is out of the way, it’s time for the backstory. Back in the early 2000s, I used ACL for most of my data analytics automation. One of the commands that hadn’t been written for it yet was CROSSTAB. This performs a cross-tabulation, basically the same thing as creating an Excel Pivot table.
Fun Fact: Excel Pivot Tables were created in 1993 as part of Excel 5, but were first developed by the Lotus Corporation in 1986, releasing the functionality in 1991 as part of Lotus Improv for the NeXT platform.
To Pivot/CROSSTAB, one field is selected for the row category values and another field is selected for the columns. The number of rows and columns each represents the count of the unique values in (separately) the rows and columns fields. Then, in the row/column intersections, you provide a numeric field for totaling. That is, if you have a file that has 20 rows of contract awards with 3 different contract types and 4 different vendors, your Pivot/CROSSTAB would show 3 rows of contract types and 4 columns of vendors with the total per contract type rolled up by vendor and shown in the 12 cells.
But how to do this in pre-CROSSTAB ACL? The underlying needed base logic was incorporated into different commands in ACL Desktop, so it was possible to cobble together a set of scripts that allowed the display of data in a cross-tabulated format. This would allow for the selection of a row, column, and total field. If I remember well, I wrote the script to perform these steps:
- Use SUMMARIZE to create a new file that lists each total for the ROW-COL combinations
- Use SUMMARIZE to create a second file that only gives a list of all unique ROW values
- Use SUMMARIZE to create a third file that only gives a list of all unique COL values
- Write a loop that opened ROW file, saved the name of the ROW value in record 1 to a variable (v_RowName), went to the COL file, saved the name of the COL value in record 1 to a variable, went to the ROW-COL file and filtered on both values, TOTAL and save the dollar field to a variable, v_TotalValue (no hits will result in a zero TOTAL). Do this the number of times equal to the total row count of the COL, iterating by 1 to create additional variables and capture each v_ColName.
- Create headers by writing all variables to a new file: v_RowName, v_ColName1, vColName2, … vColNameX. Create the first row of data by writing the variable values for NEXT 1 to only export one line. ACL runs commands on all records, so the variable export needs to limit to just the NEXT or FIRST 1.
Ok, maybe this isn’t the best description of a fully functioning CROSSTAB script from back in the day. I’ll go re-create it and update the above description when I get a chance. I’ll post my results in the comments below when I produce them.
I thought that this particular script, and some others that I had created were pretty neat. So I entered the 2002 ACL User Challenge. During the 2001 ACL User Challenge, I had been recognized for some work that I had done with complex Workers’ Compensation data. While my new scripts for 2002 weren’t quite as fancy as that analysis, they were included in a compilation with other users’ projects on this CD:

Yes, I am one of those people who have many CDs, 3.5″ floppy disks, a few larger (actual) floppy disks, and even some ZipDisks in some boxes in my home office closet. Recently I went on an “archaeological” dig into the closet, nearly trapping myself in there. However, I emerged victorious with this relic of the past, “A compilation of innovative 2002 User Challenge entries.”

My entry read like a personal ad for some sort of data analytics dating site. 🙂
Computer specialist, Angela Watterworth, a member of the CAATS team at USPS OIG, enjoys automating processes and developing batches to reduce redundant, manual work. Consequently, she applied her “creative logic” to optimize ACL functionality.
Using ACL™ for Windows, Angela created three applications.
* Subtotal Reporting: to produce a Microsoft Excel spreadsheet as output with subtotals already in place. She wrote a batch to automatically create subtotals, and then export the results to a delimited file, which in turn, she imports to Excel.
* Category Extract: to automatically break a file into specific categories based on one key field. For example, auditors can select an input file definition such as “Contracts” from a drop-down list. Then, from another drop-down list, they can select a key field such as “City” to export all records for each city to a separate file.
* Unique Sampling: to automatically select samples that let you look at certain characteristics of the data. For example, you might want to review at least one record from each US state or each type of contract from your data.
My CROSSTAB script was a combination of the Category Extract and Subtotal Reporting, I believe. I love that ACL/Galvanize, even today, incorporates ideas and suggestions from their users to make their software more effective.
Conclusion – Unlimited Possibilities
These days, there are tons of pre-built libraries available for every sort of programming language or software application. The possibilities are unlimited. We had to be creative with just a few tools in the past, but today we can typically find the answer to our challenges by googling, watching youtube, going old school and reading documentation, or even crowd-sourcing.

Help me solve this challenge. I’ll update this post to clarify anything that is unclear as people engage with it. According to Will Kroboth, creating these graph output files is a “small problem.” If you have a few minutes and find this sort of thing fun, suggest an answer!
2 Comments
Di
Ah, that photo of floppy disks has brought back some memories for me!
Aaron
Checkout RStudio, with ggplot2, dplyr, and shiny. You can create a markdown document using R and ‘knit’ it into a pdf.